Map tools
The map tools aim to support public health planning by the following functionalities:
Map browsing
Visualization and comparison of different population models
Microplanning
Map browsing
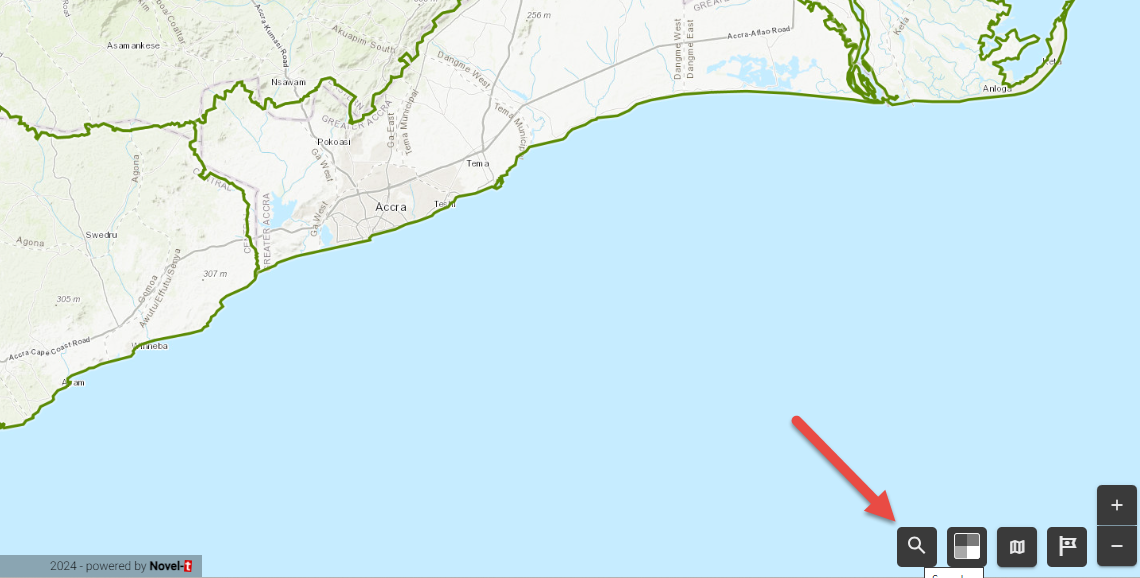
Search
You can use the search to find admin / health boundaries, cities, places, POIs, etc. Click on the search icon:
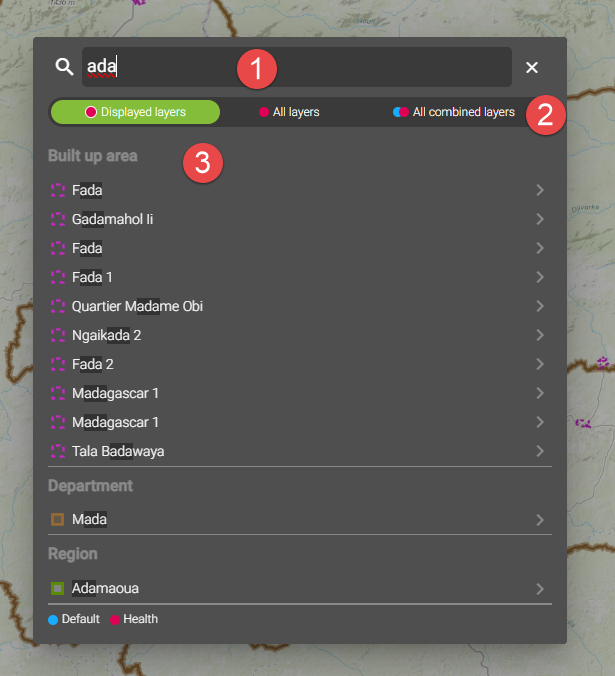
Type in the search dialog
‘Displayed Layers’ shows only layers that are visible on the map, ‘All layers’ searches layers that are not visible (selecting a result in this section results in activating that layer), ‘All combined layers’ searches across the different boundaries, if present (ie Default and Health boundaries for instance)
The results are grouped by layers
Location tools
Find coordinates
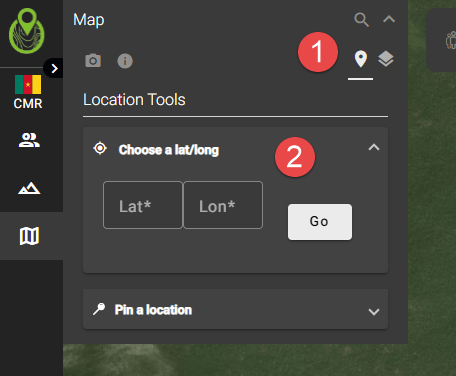
If you have a set of coordinates that you would like to navigate to on the map, you can use latitude and longitude to find this place.
Click on the location tool
Select the lat/long tool and enter your coordinates
Pin a location
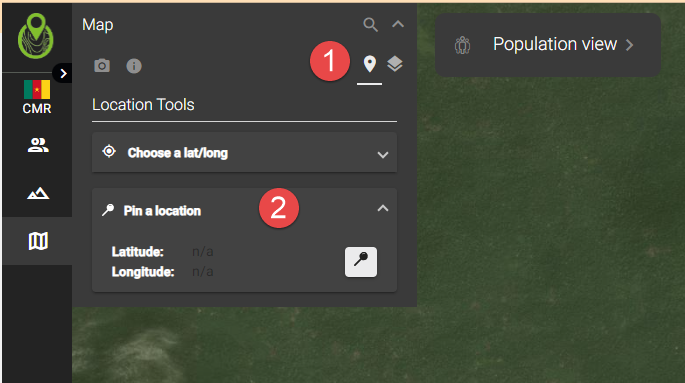
If you want to obtain the coordinates of a certain location, you can use the ‘Pin location’ tool:
Click on the location tool
Select the ‘Pin a Location’ tool and mark the point on the map you want the coordinates for:
Identify
By default, the features on the map cannot be selected. However, if you want to get more information on the features on the map, you can toggle on the ‘Identify’ tool. To do so, click on it:
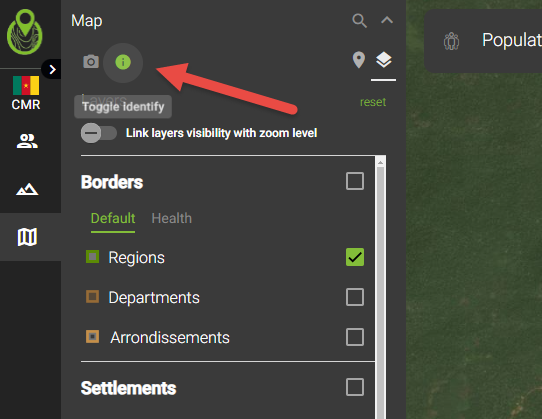
You can then select features on the map and get information on them:
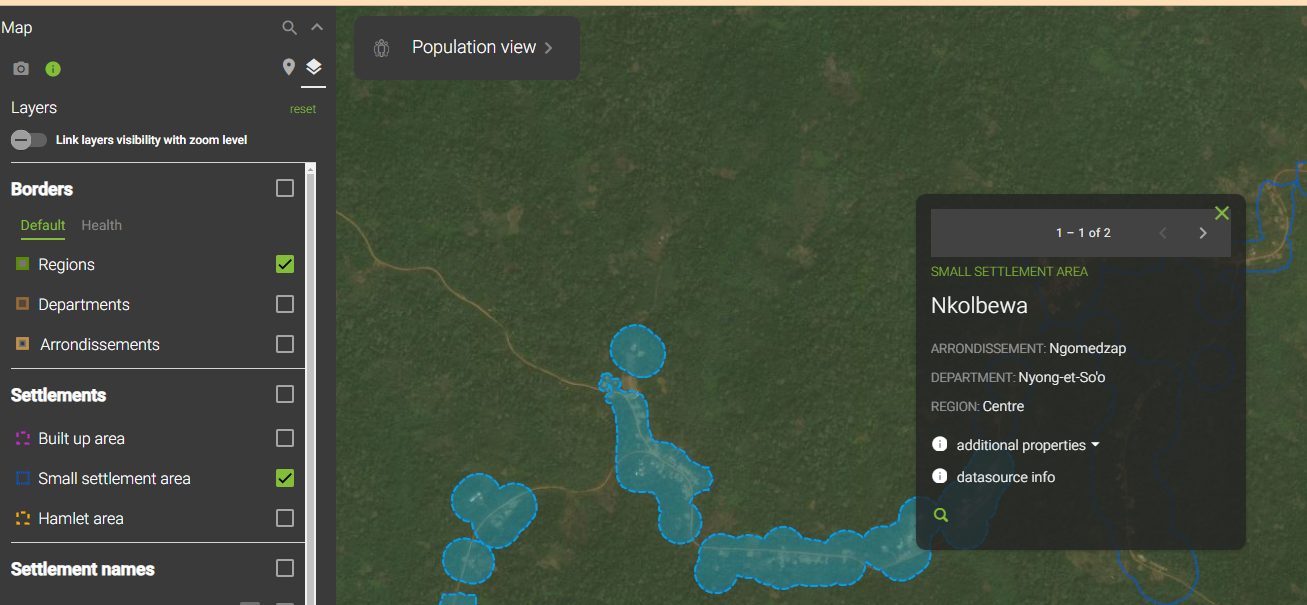
Note, you can obtain information on the data sources using this feature and for some features there may be additional properties to expand.
Print current map view
To get a snapshot of the features displayed on your map, you can use the ‘Print map view’ button:
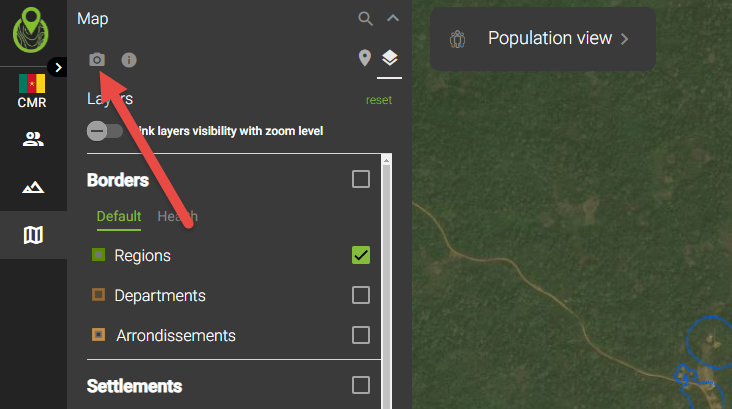
Note, the basemap will not be captured this way.
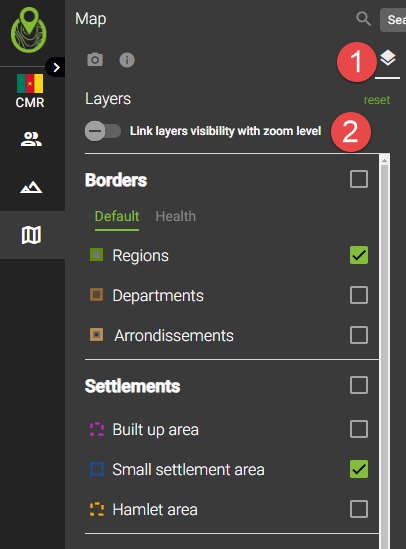
Layer selection
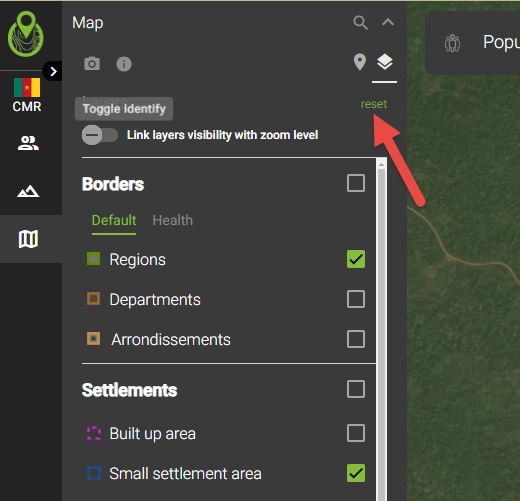
To see what layers are active on the map, navigate to the layers menu (number 1 on the screenshot below). By default, layers are locked. If you want layers to show up according to the zoom level you are at, click the ‘Link layers visibility with zoom level’ button (number 2 below):
Hint
You can always reset the initial layer selection by clicking on ‘reset’, as shown below.
To only select a number of layers of your choice:
Deactivate or activate the layers individually in the layer list
Boundaries
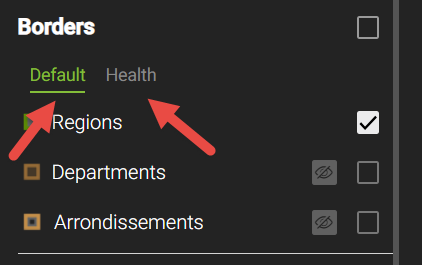
Some countries show two type of boundaries. To change between them, simply select the corresponding button.
Settlements
The settlement layers are divided into three categories. Built up areas (BUA), Small settlement areas (SSA) and Hamlet areas (HA). There is a related category called ‘Population outside of settlements’ (POS). For more information on this, please refer to the POS. The BUA, SSA and HA layers are typically the result of aggregating building polygons into settlement polygons, following this code: https://github.com/novelt/building-aggregation-tool. They are classified as follows:
BUA (Built up area)
A polygon is a BUA if either of the following conditions are fulfilled:
The polygon intersects >= 3000 buildings
The polygon has population raster values >=13 over an area of >= 400,000m²
SSA (Small settlement area)
An SSA has >= 50 buildings and is not a BUA
HA (Hamlet area)
Everything else is a hamlet area
Important
Some settlement layers may contain also an additional category: Degrees of urbanization. This may not strictly be correlated to the above categories.
Settlement names
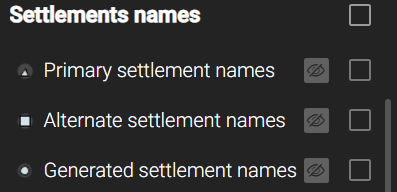
Settlement names are divided into primary, alternate and machine generated names.
A settlement point layer is intersected with the settlement polygon layer. Settlement points that fall within a polygon will typically result in the primary name (or also ‘Settlement Names’ for some countries). In cases where there are more than two settlement points that intersect one polygon, one name will be retained as the primary name and all further points will become alternate names (or ‘Sub-Place Names’ for some countries). If no settlement point intersects the polygon, this polygon will be named automatically and thus have a machine generated name. Such a name will have a prefix for the settlement polygon type (ie. ‘HA…’, ‘SSA…’, ‘BUA…’) it corresponds to.
Health facilities
Health facilities on the map are divided into two main layers and further divided into sub-layers. The two main layers:
Inside boundaries: Health facilities that are located inside the country boundaries (by geospatial intersection)
Outside boundaries: Health facilities that are located outside of the country boundaries (by gesopatial intersection)
Health facilites within the country are further divided into three layers:
On water: Health facilities that are located on a body of water (ie. a river, a lake etc, via geospatial intersection)
Outside settlement: Health facilities that are located outside of a settlement polygon (ie. outside of a BUA, SSA and HA, via geospatial intersection)
Valid health facilities: All other health facilities are grouped under this layer
Hint
A layer only shows if there are features present for this layer, meaning if there are no health facilites on water, this layer will not show.
Population tools
GeoPoDe exposes population data. The population data source is typically a population raster. This population data can be utilized to
visualize population data per boundaries and quickly understand where the bulk of the population is
compare different population models (if several models are available)
query population in certain areas (for instance around health facilites) - this feature can be used to generate a microplan
The data can be downloaded in excel format.
Visualizing population by admin / health boundary
Important
The demographic breakdowns are typically sourced from WorldPop and the ratios applied to other population rasters, if applicable.
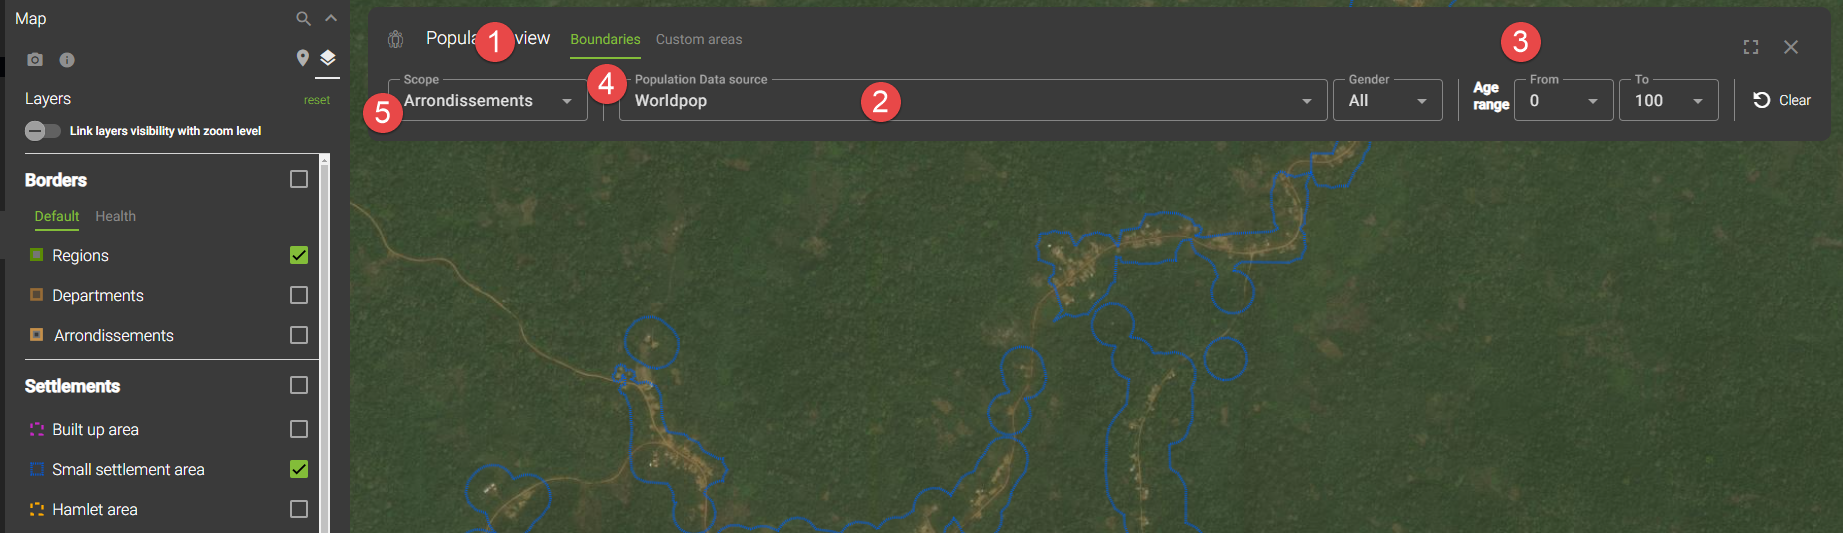
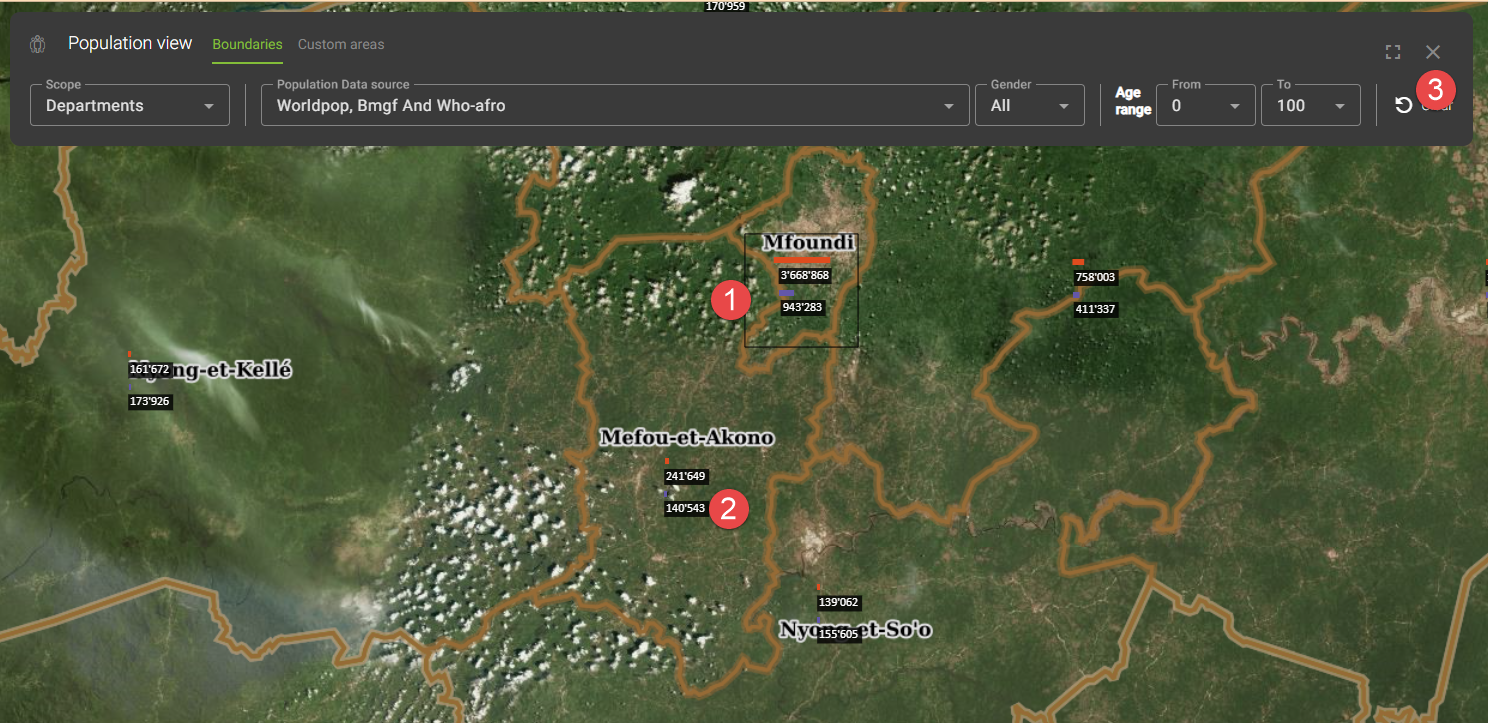
Expand the population window
Select a population source or multiple sources
Select the demographic criteria (i.e. gender and age)
Per default, population is shown by ‘Boundaries’
You can adjust the level at which the population values show
The bar charts along with the numbers on the map show the population distribution relative to what is visible on the screen.
The black box indicates where the highest population value is on the current screen (this changes as you zoom in and out, as more or less areas become visible)
Different colors represent different population sources
You can adjust the demographic values which will be applied directly
To hide the population, close the population window.
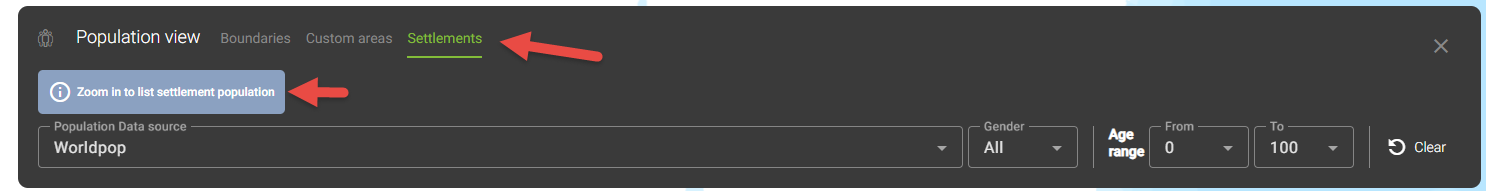
Visualizing population by settlement
To show population by settlement, select the ‘Settlements’ tab.
Hint
Population by settlement is only shown at a certain zoom level. You need to zoom in, as indicated, to have the values available.
Once zoomed in, click on the ‘List’ button to show the settlement population tab.
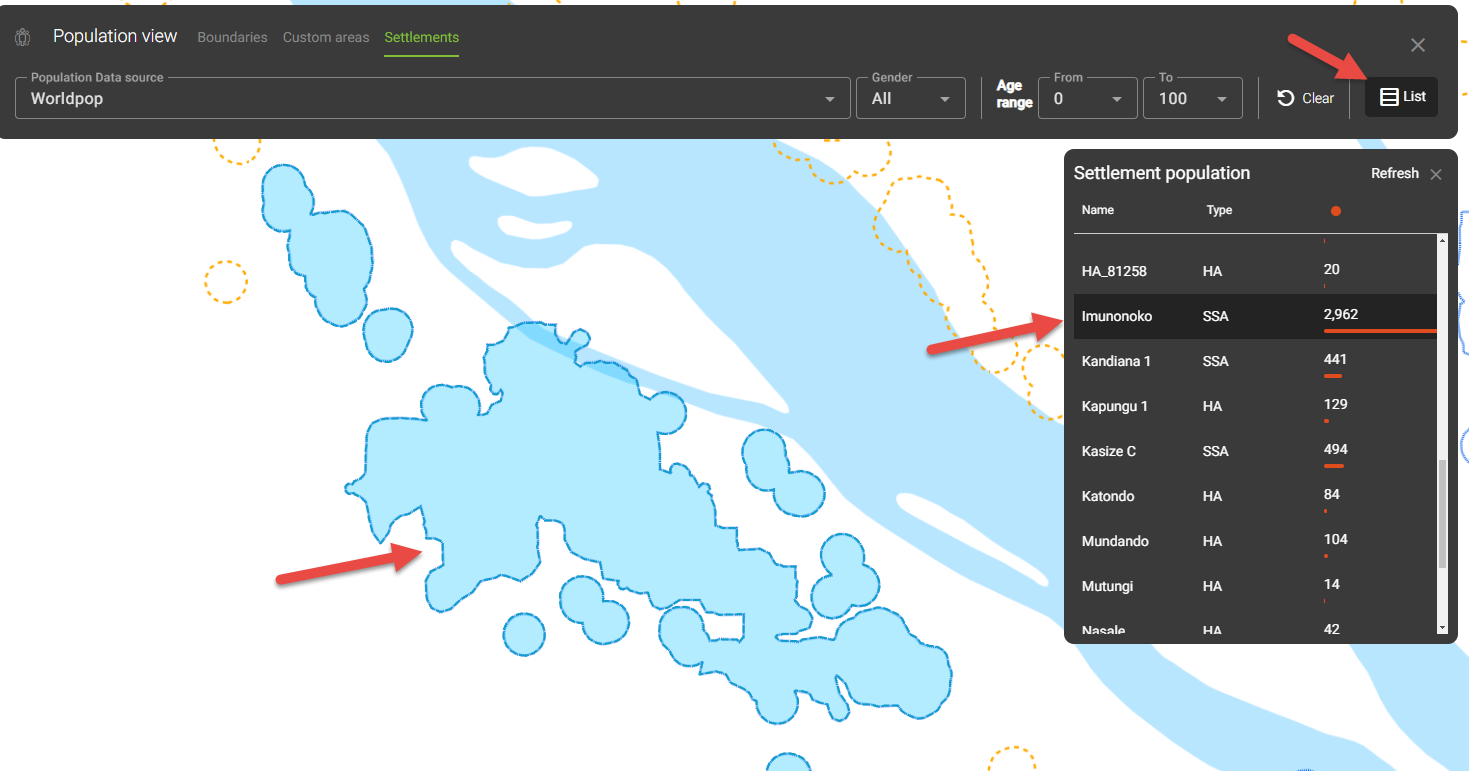
To adjust the population parameters, follow the same procedure as outlined above for visualizing population by admin/health boundaries.
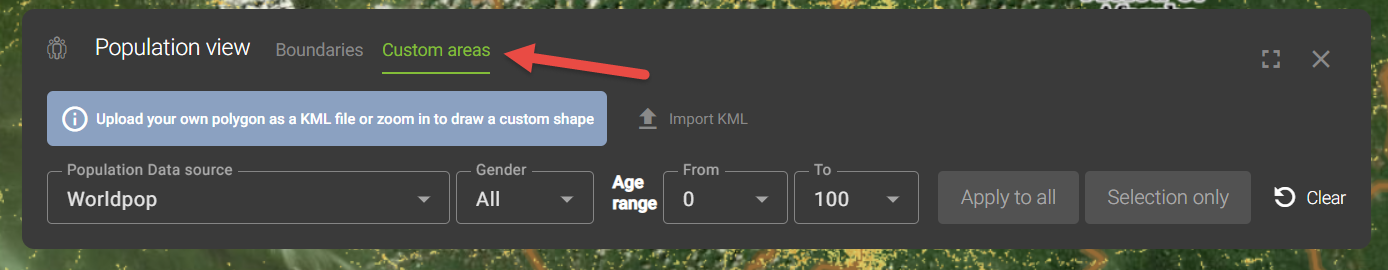
Visualizing population by Custom query
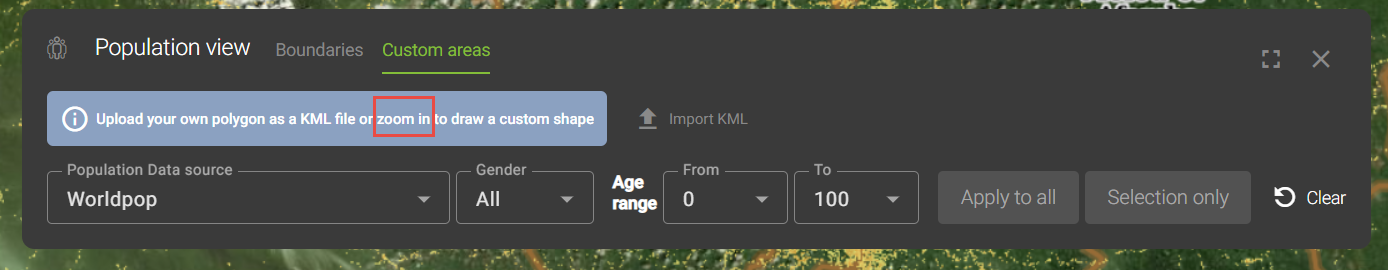
To query population for a custom area, switch to the ‘Custom shape’.
Important
This will only work if you are zoomed enough. In case you are too far out, a message will highlight that you need to zoom in.
There are three options to query population:
Custom polygon
Circular buffer
Import of KML files
To draw a custom polygon
Make sure you are on the custom areas tab
Select the population source(s)
Select the demographic parameters (i.e. gender and age)
Select ‘Polygon’.
Draw the polygon on the map by clicking and finalize the polygon with a double click
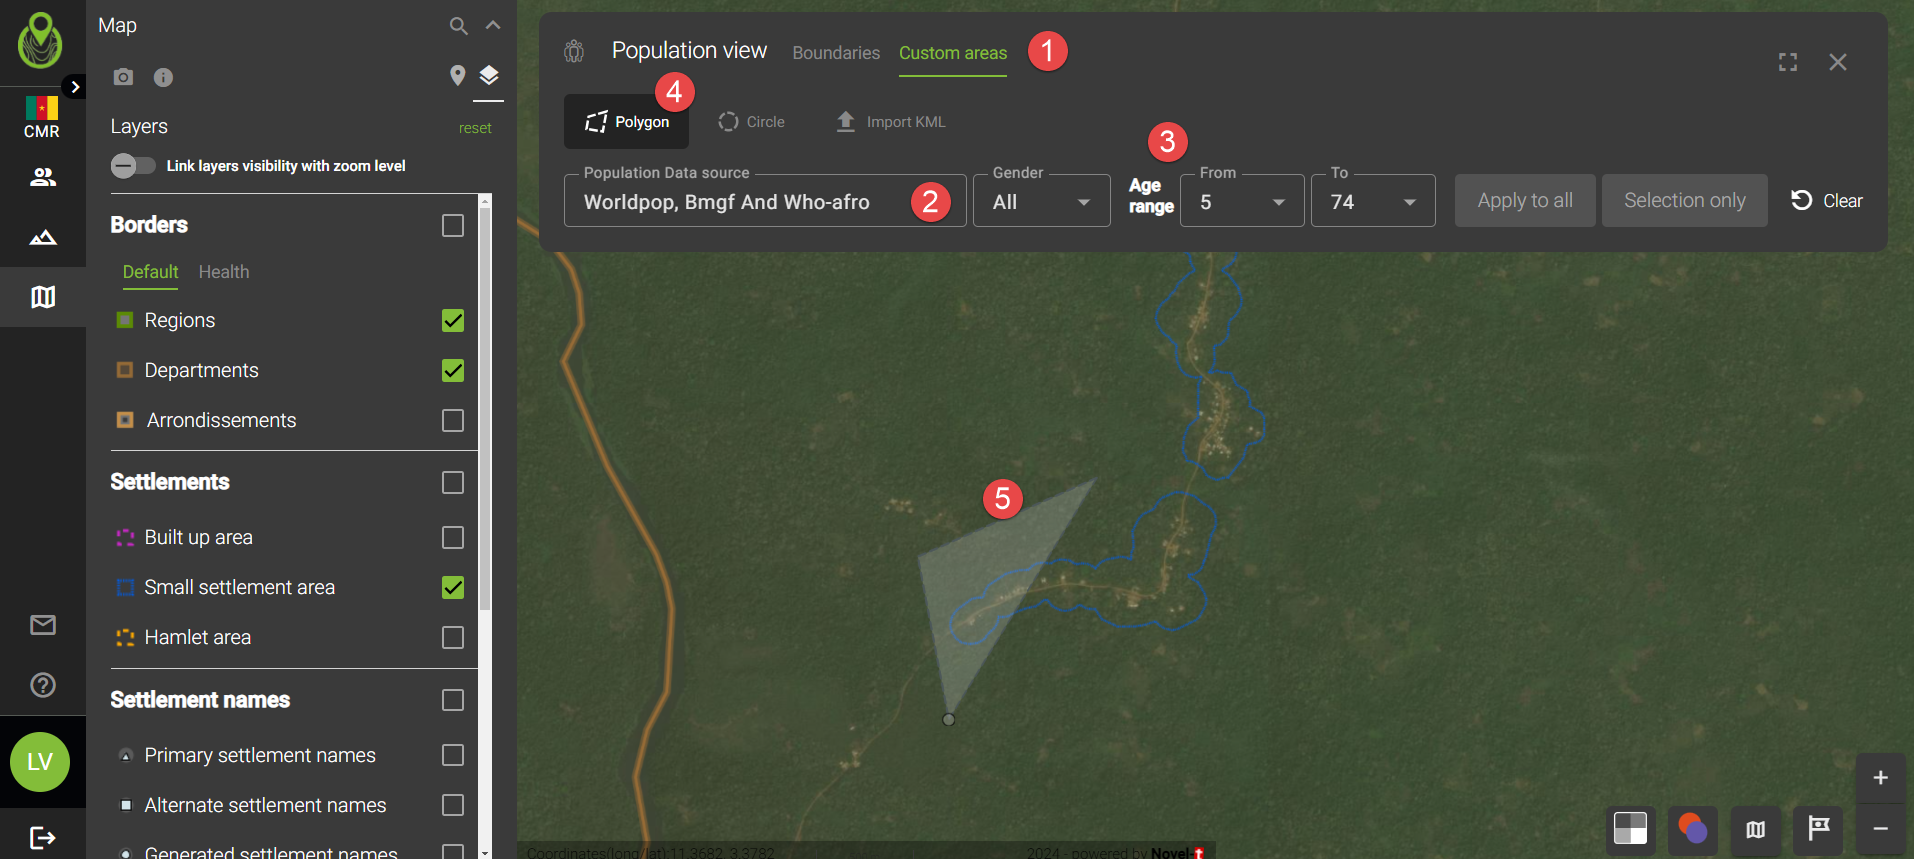
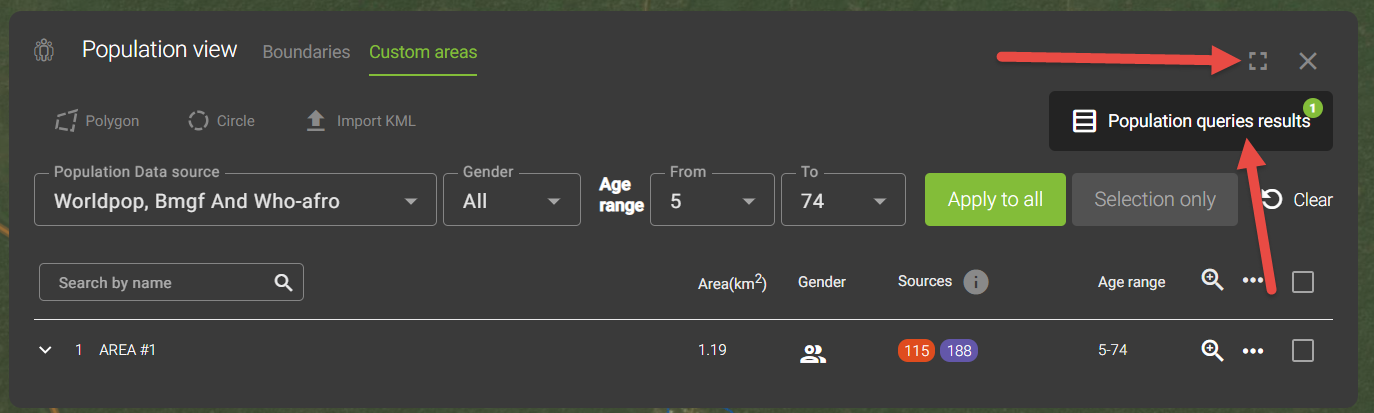
The table with the results will automatically open, but you can close that table or go into full page mode:
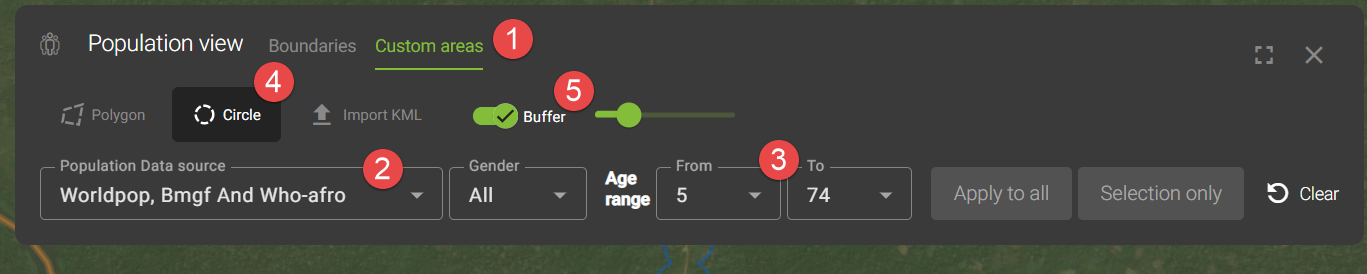
To draw a circular buffer
Make sure you are on the custom areas tab
Select the population source(s)
Select the demographic parameters (i.e. gender and age)
Select ‘Circle’.
Manual drawing on the map allows you to choose the circle size. Alternatively choose ‘Buffer’ to enter a distance (this will correspond to the radius of the circle).
Click on the map where the circle center should be
Once finalized, you can show the population query results by clicking on the button:
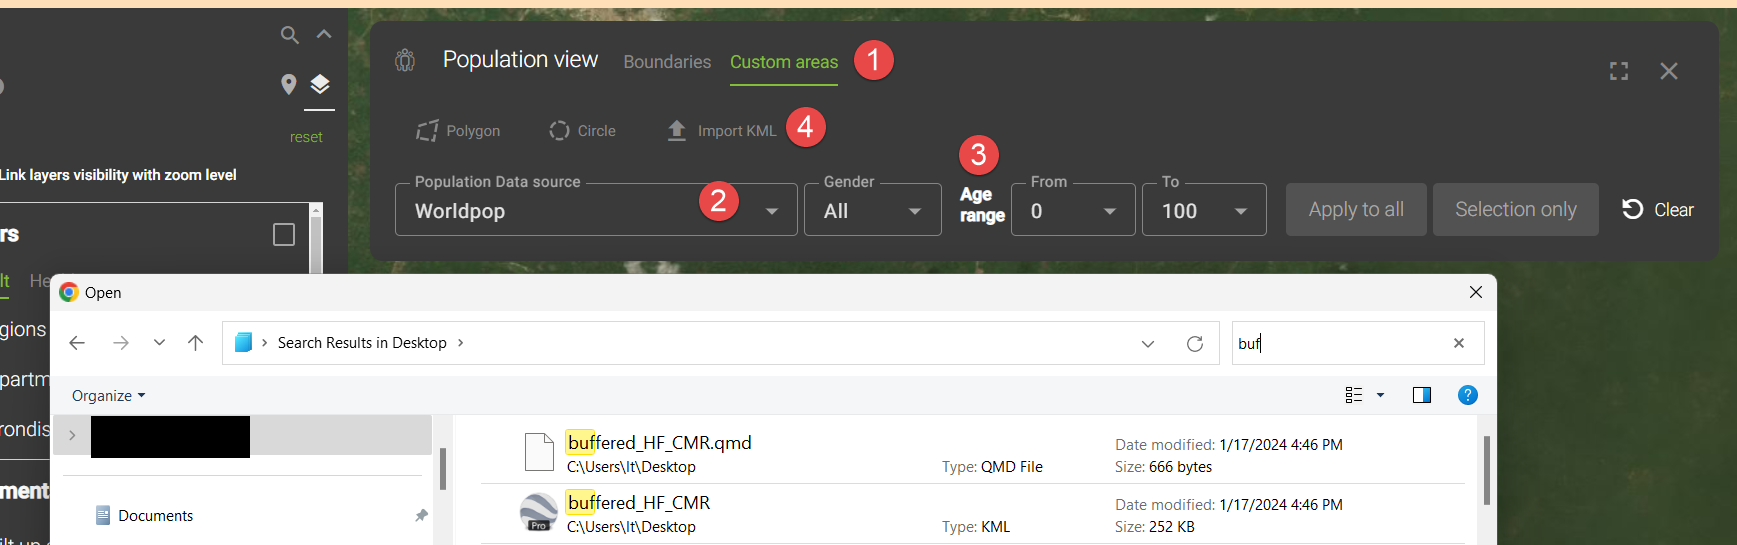
To use the import function
Important
Only KML files are currently supported as upload files. Depending on the size of the query, this could take a considerable amount of time. In this case, do not close the window.
Make sure you are on the custom areas tab
Select the population source(s)
Select the demographic parameters (i.e. gender and age)
Select ‘Import KML’
Select the file
Hint
The KML file can contain multiple shapes - all of those will be queried. Thus, you could easily query all catchment populations for all health facilities for a country this way. To do so:
Export the health facilities from GeoPoDe (see Geometry export)
Import them into QGIS or another geospatial software application
Create a buffer around the points (for instance, in QGIS use ‘Buffer’) according to the catchment size (for instance, 2.5km)
Save the buffered points as a KML file
Upload the KML file in GeoPoDe
This is an example of an upload of all the buffered health facilities in Faro-et-Deo in Cameroon:

Population results
Once the population query has finished, you can consult the result in the table. The results table has the following functionalities and informations:
Search for a settlement name or area name (in this example, for instance health facility names that stem from the KML import)
Export all results as either Excel table, KML file, delete all results
Row summary and row actions: population in catchment, KML export, zoom to area and delete row
Row details - settlements in polygon / catchment areas and individual population per settlement

Reprocessing population queries
Once a query has been done, the parameters can be changed and the areas can be reprocessed. To do so:
Select the areas you want to reprocess in the table
Adjust the parameters as needed
Apply the settings (either to the selection or to all areas, as needed)

Note, you will be warned that existing queries will be replaced. You can either apply the new settings and ignore this, else you can always download the existing data before reprocessing.

POS (Population Outside Settlements)
POS is an abbreviation of ‘Population outside of settlements’. This concept was created because population is typically attributed to settlements. For instance, when a population value coming from a population raster (see Population tools) intersects a settlement with type ‘SSA’, all population rasters that intersect this SSA polygon will be attributed to that particular SSA and thus that SSA will have one population value - the sum of those raster squares. However, if the population value is at a place where there is no settlement data, this population is assigned to a new settlement type: population outside of settlements (POS).
Why could this happen?
This will typically happen in either of two cases:
The population raster has not been generated using buildings to constrain the population (for instance see https://www.worldpop.org/methods/top_down_constrained_vs_unconstrained/).
The building layer used to constrain the population on the population raster does not match the building layer that was used to create the settlements.
POS are not shown on the map per default. However, doing a population query will highlight if they exist in a certain area:

You can also search for POS or names. The map will zoom to the area, but you won’t see a feature on the map. To see them, you will have to export this layer - see POS.
Important
POS are always linked to a specific settlement and population source. If there are several population sources for one country, one population source may create POS while the other may not - for instance when one source used buildings to constrain population and those buildings correspond to the settlement layer, while the other source did not constrain population at all.